
Note: The AI Impact Report is available for Beta customers and can be accessed by Owners, Admins, and Managers. This feature requires Advanced Data Capture to be enabled.
TL;DR
The AI Impact Report provides insights into AI tool usage, including adoption rates, time saved, and estimated ROI. Enable Advanced Data Capture, wait 24 hours, and review report widgets to analyze AI-driven productivity.
The AI Impact Report provides visibility into how Users interact with AI tools and how this usage impacts productivity, efficiency, and time savings.
Analyze AI adoption across Users and groups to identify:
- Usage trends
- Estimated time saved
- Business value generated from AI-assisted work
How It Works
- Log in to the Time Doctor Dashboard.
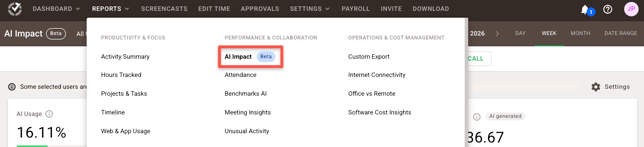
- Go to Reports / AI Impact Report.
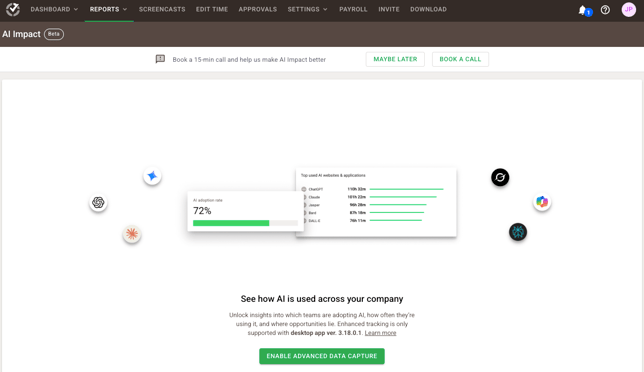
- If the report is inactive, enable Advanced Data Capture:
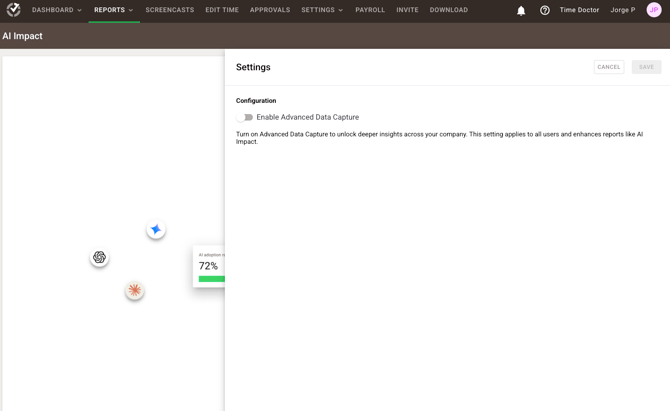
- Open the Settings panel.
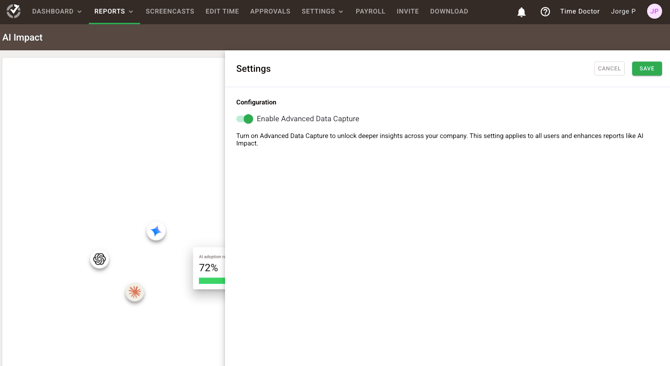
- Turn on Enable Advanced Data Capture.
- Open the Settings panel.
- Allow up to 24 hours for data collection.
- Select the desired:
- Date range
- Users
- Groups
- Review report widgets to analyze:
- AI adoption
- Usage patterns
- Efficiency gains
Tip: The report updates every 24 hours.
For setup instructions, refer to Advanced Data Capture documentation.
Understanding the Data
The AI Impact Report evaluates how selected Users interact with AI tools and translates this activity into productivity insights.
Key metrics include:
- Adoption: Number of Users actively using AI tools
- Efficiency Gains: Estimated time saved using AI
- Business Value: Estimated monetary value of saved time
- Usage Patterns: Common AI tools and task types
- Skill Development: Improvements in prompt quality over time
Widget Descriptions
Note: Several metrics in this report—such as AI Usage Rate, Time Earned, ROI Impact, Prompt Categories, Time Earned vs Time Spent by Task, Prompt Accuracy, and Prompt Accuracy Over Time—are generated using AI models. These values are estimates and should be used as indicative insights rather than exact measurements.
AI Usage Rate
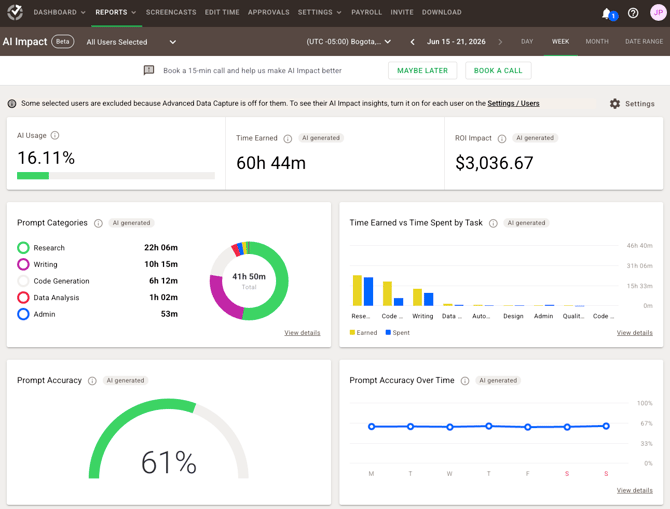
Displays the percentage of selected Users who used AI tools during the selected period.
A User is considered to have used AI if any activity is recorded, even for a few seconds.
Time Earned
Displays the estimated hours saved through AI usage.
Time earned represents the difference between completing tasks with AI assistance versus manual effort.
ROI Impact
Displays the estimated monetary value of time saved through AI usage.
This is calculated by multiplying the estimated time saved by an AI-suggested hourly rate based on the User’s job role.
Prompt Categories
Displays the distribution of AI usage by task type, helping identify how Users interact with AI tools.
Categories include:
- Writing
- Research
- Code generation
- Debugging
- Other
Each category shows:
- Percentage of total AI usage
- Total time spent
Side Panel:
Click a category to view a detailed breakdown per User, including:
-
- Total time spent in the selected category
- Prompt accuracy score (average quality of prompts based on accuracy guidelines)
Time Earned vs Time Spent by Task
Compares time spent using AI with the estimated time saved across task categories.
This highlights efficiency gains by showing how long tasks take with AI assistance versus estimated manual effort.
Side Panel:
Click a category to view a per-User breakdown with:
-
- Time Spent: Duration of AI interaction
- Time Earned: Estimated time saved
- Net Time Saved: Difference between time earned and time spent
Prompt Accuracy
Displays the percentage of AI-generated responses accepted without edits.
Prompt Accuracy Over Time
Displays trends in prompt accuracy over time.
Use this metric to track improvements in prompt-writing and efficiency when interacting with AI tools.
Top 5 Users by % Time in AI
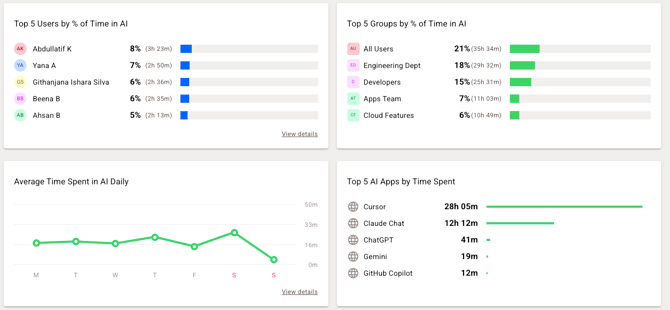
Displays Users with the highest percentage of time spent using AI tools, along with engagement insights.
Side Panel:
Click a User to view a day-by-day breakdown, including:
-
- AI Activity: Engagement level (Very High, High, Medium, Low, Very Low)
- Average Time Spent Daily: Daily AI interaction time
- Share of Daily Usage: Percentage of workday spent using AI tools
Top 5 Groups by % Time in AI
Displays groups with the highest percentage of time spent using AI tools.
Average Time Spent in AI Daily
Displays the average daily time Users spend interacting with AI tools.
Side Panel:
Click a User to view a detailed daily breakdown, including:
-
- AI Activity: Engagement level (Very High, High, Medium, Low, Very Low)
- Average Time Spent Daily: Daily AI interaction time
- Share of Daily Usage: Percentage of workday spent using AI tools
Top 5 AI Apps by Time Spent
Displays the most frequently used AI tools.
Examples include:
- ChatGPT
- Claude
- Cursor
Should there be any inconsistencies or concerns regarding the article, contact support@timedoctor.com for prompt assistance.